Look around. Data has become the most powerful resource. And surveys the most powerful technique to gather these resources.
Old or new, paper or online, face to face interviews or telephonic— everyone’s using research methods for collecting data.
Surveys give the power of social research on any demography, organization or an individual. In surveys.. We trust!
Surveys are all-around because they are a powerful mechanism to research and collect data from any predefined group of respondents or individuals.
The idea is to gain information from your target audience on various topics and use it for the greater benefit of you and the society.

Research has gotten extremely important in 2020, and surveys empower you to conduct these social researches with different survey methodologies.
Flawed data can misguide the greatest of the leaders, giants of the companies, and well-established nations.
When your success depends on a survey, you need to be absolutely spot on with your collected data and its survey method.
The quality of your data will decide if it will have a negative or positive impact on your objective.

On many occasions, flawed data has failed leaders, organizations, and the constitutions on a whole. Relevant survey data is directly proportional to stronger decision-making.
Survey data tells about what the respondents think. At least that's what you'll interpret in the first look.
The data that you collect from surveys are survey data. They tell you about what your respondents think.
However, there's a great deal of controversy among social & survey scientists about designing and suggesting perfect survey methods.
The data that you may be receiving might be skewed. Its probability increases with ill survey-designing and wrong survey methods. So, you might think what you have is perfect, but that's not always true considering the number of factors affecting the survey.
Survey methodologies should be tried-and-true. Know all the researching methods and pick the one that suits your requirement. The way you conduct your survey or collect data for statistical analysis in research is called survey data methodology. Conventional wisdom regarding surveys demonstrates that each survey data methodology has a unique role to play.
Some use multiple mediums to collect opinions and feedback from the targeted sample of individuals. Various survey methods across several mediums help reach the required number of survey responses and enough food for thought for wise-decision making.
You can reap effective data from any survey methods if you know how to design surveys and adequately communicate the survey's objective to the respondents.
Go for the tried-and-true ones because what matters in surveys is not always mentioned in statistical science.

Survey data methodologies have evolved with technology. Each generation is trying to collect data on a level playing field to avoid biased opinions.
The world of survey data collection has evolved with time and technology, each trying to minimize the influence of biased opinion on the outcome of the research. Surveying companies use standardized methods to ensure that each respondent supplies information at a level playing field without affecting the quality of survey data.
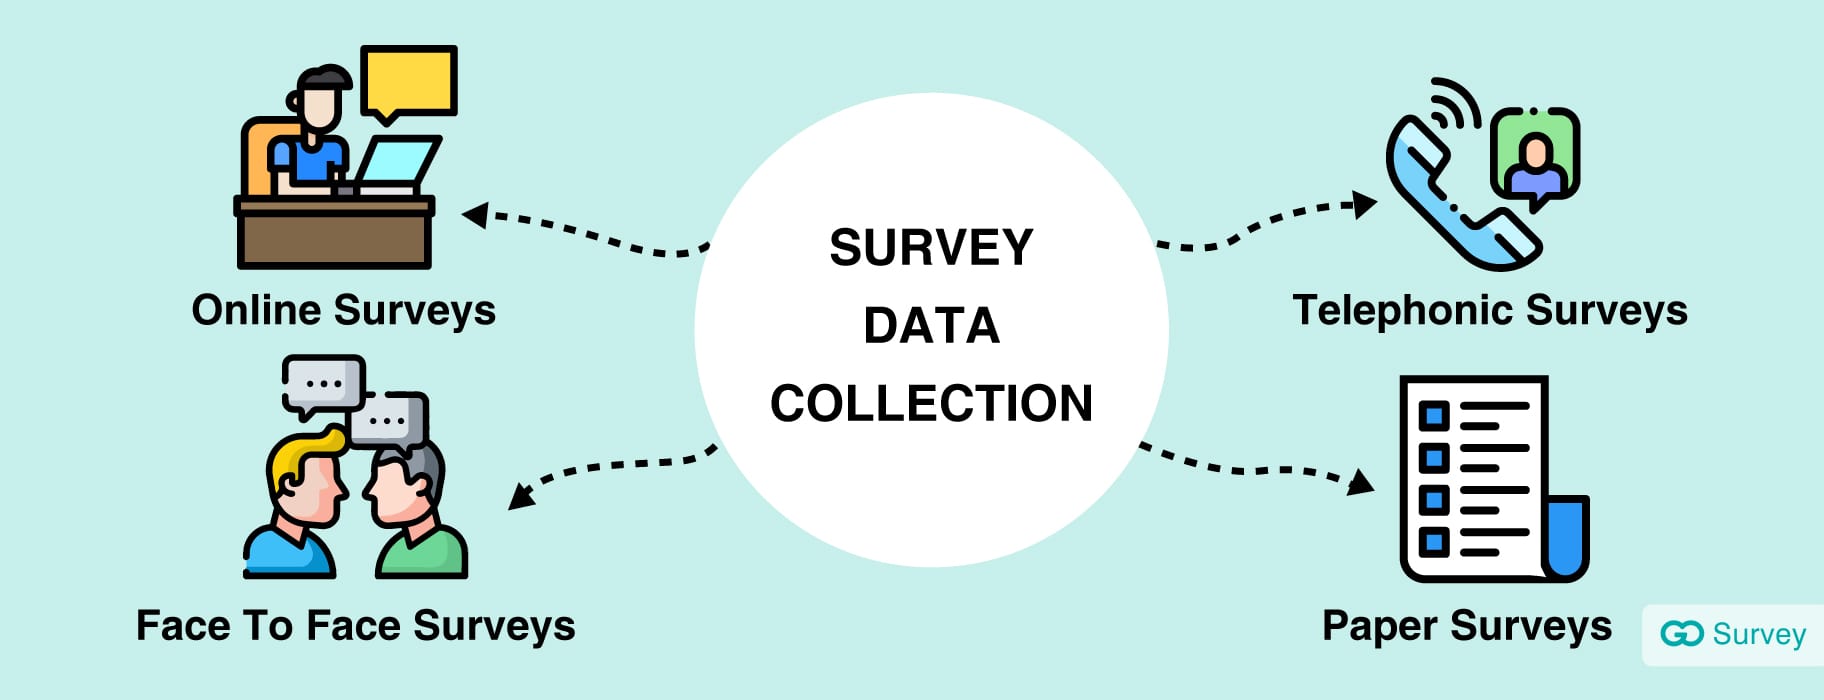
From in-person, telephonic surveys to email surveys and online surveys— all the survey methodologies have standard ways of filing questions and conducting them.
Each survey data methodology has its merits and demerits, and even searchers can have a bias for choosing one over another.
Before you pick any of these methods— you must understand essential aspects such as response rates, impact, reach, etc. for each one of them.

Again, there’s no aggressive way to claim one better over another because these surveying methods are picked based on target population characteristics as well as the intention of the survey.
Types of survey data collection methodologies— based on deployment/implementation.
Survey data methodologies have two groups: actual implementation (deployment) or surveys-based on design.
In the current section, we’ll cover how data are actually implemented, i.e., the modes of deployment on any particular sample field.
#1 Online surveys
Online surveys belong to the latest generation of survey data methods. They are one of the most cost-effective ways to collect data, and that can be interpreted with their widespread use in comparison with other data collection methods.
When do professionals use online surveys?
Researchers prefer this survey methodology when they have multiple questions to ask from a large size of the target population.
Pros
- use high computational logics and branching technologies to gather accurate data
- easy to create and implement across a broad target sample.
- don't consume much of the respondent's time. The feature is boon for the answerers who have less time to respond to your set of questions.
- need low investments for arranging the format. Work on "low spending and effective output" principle.
- reach a wide-audience group in the quickest time compared to any other mean. It also increases response rates.
- collect real-time data for early insight and help create actionable roadmaps as corrective measures.
- respondents can answer the questionnaire at their own time, interest, preference, and pace.
- complex surveys are made easy with flexibility in designing online questionnaires.
Cons
- the absence of interviewers makes these surveys look more mechanical and lag timely intervention.
- can't reach challenging populations like non-digital friendly elders and regions that don't have internet. (Offline mobile survey apps are filling the gap now)
- survey frauds are quite common. People may answer for the sake of survey incentives and giveaways, thereby leading to a skewed data set.
Response rate:
Response rate depends on the surveying campaign and calls to action you use. The rates can be as low as 2% in external surveys to 85% in well-distributed & optimized survey campaigns. But the average online survey response rate is 29%.
Example: Hotel or real-estate industry for online feedback.

#2 Face to face surveys
Face to face surveys have existed for ages. The oldest of all the generations— face to face mediums— are the most effective mediums in conducting primary search for substance in data.
Researchers use psychographic techniques to make these surveys successful.
To make the survey more instinctive, accurate, and customizable at the time of response— researchers need to pre-training the psychological tricks.
When do professionals use face-to-face surveys?
Researchers use this mean of the survey to deduce a solid validity of response by detecting social cues, body language, and visual aids.
Pros
- allows personalized and in-depth data collection and gives a comprehensive understanding of it.
- facial expressions, gestures, and body language are read to add solidness in the survey response.
- a data collector may explain complex questions by identifying the respondents' discomfort and resolving survey hiccups during the face-off.
- the researcher can use visuals and stimulant materials to collect substantial data.
- respondents feel committed to personal surveys. They can share authentic and coherent data about the subject and their experience.
- help to personalize surveys or conduct tailored investigations in case of sensitive topics.
Cons
- very time-consuming. Needs arrangement, appointment, meetings, discussions, and then analysis.
- demands high cost-investment early on because of traveling and meeting. In fact, more than any other deployment method.
- data collectors can skew the data based on their biased opinions.
Response rate:
Highest response rate at about 57%. Since it's embarrassing for people to spank off the doors in the face of live collectors, most in-person surveys are given nods.
Examples: News reporting, reading criminals psychologically, a B2B research, or HR interviews.

#3 Telephonic surveys
Telephonic surveys have a partial bit of human factor when compared with the face to face surveys.
And despite that, the methodical approach requires lesser time and investment than face-off surveys.
Researchers and surveyors are trained to conduct friendly equations with the respondents. But the medium hardly permits social connections as much as the first-generation of surveys.
When do professionals use telephonic surveys?
Researchers and marketers use telephone surveys in B2B and B2C businesses to learn what their clients and customers think of their brands. They also identify customer behavior pre and post-purchase cycles.
Market research people use telephonic questionnaires for competitor gap analysis and evaluating the feasibility of the new idea, product, or service concepts in the market.
Pros
- high accessibility. Most people who own phones are reachable.
- depending on the reach, telephone surveys are cost-effective. Costs nothing if studies are done through online calls. Cost a little more than online surveys if conducted through mobile networks.
- bring in the human factor at less effort, time, money, and workforce than f2f survey mediums.
- establish a human environment more than online surveys but less than f2f reviews.
- provide anonymity more than any other survey data methodology. The respondent can choose to hide his identity if he wants to remain discrete while giving his opinions.
surveyors can dig through substantial responses.
Cons
- researchers often interrupt or disturb respondents due to time constraints. Data collectors need to identify the calling window, which is suitable for respondents.
- can go long without collecting any reliable data. It’s advised to wrap up telephonic surveys in less than 15 minutes.
- difficult to reach a sample audience. DND and call screening options affect the survey reach.
surveys are disconnected or deserted if there’s no friendly equation or incentive.
Response rate:
The overall response rate of telephone surveys has dropped a fair bit in two decades. It lingers around 18 to 20% currently!
Examples: Retail giants for customer-feedback, authorities for social surveys, and canvassing.

#4 Paper surveys
Also called a pen and paper data collection method, paper surveys are used in the areas with a lack of internet connectivity, devices, etc.
The age-old method is still quite popular in under-developed demographics for field research.
When do professionals use paper surveys?
Researchers implement paper surveys for hard documents in field & sample research. And let’s not wholly shun off paper surveys. They deserve credits in the following areas:
Pros
- It is extremely readable and viable for the target samples and demographics that can’t read or are visually impaired to view texts on monitors.
- usable as paper surveys are always available as hard-proof documents.
- best for non-tech savvy people. Surveyors can’t wait for the target audience to learn online surveying data collecting tools. Highly potent when researchers want to survey despite all the surveying challenges.
- strengthen the number of responses and validity of the data gathered.
Cons
- resource-intensive in terms of manpower and financial inputs.
- consume a lot of time in personal surveying.
- impossible to analyze data in real-time and develop quick corrective measures.
- strenuous task to analyze, structure, and arrange data.
- data can be skewed at the surveyors’ level.
- have a limited reach. Involve excessive traveling of mass-collectors.
- not very environmental-friendly.
Response rate:
The response rate is high because trusted government officials conduct most of the surveys.
Examples: Census research, income-disparity research, disease impact.
Types of survey data collection methodologies— based on the deployment frequency. The second type of survey data collection methodology focuses on designing a survey that minimizes the empirical errors. They are based on the frequency of deployment rather than the way of implementation.

#1 Cross-sectional surveys
Cross-sectional surveys are conducted to know the current mood or opinion of particular demography or a subset of a predefined sample audience for a specific situation.
These types of surveys help capture information by analyzing data of variables gathered at a specific point in time.
It can be the entire population, or sample population, or the subset or attributes of the predefined community.
When do professionals use cross-sectional surveys?
Marketers and researchers deploy cross-sectional studies for learning the exact opinion of the respondent at a certain point in time for catering personalized campaigns or services.
Pros
- a strong survey methodology for proving or disapproving any argument, assumption, or statement.
- budget-friendly, especially with the solidness of data it promotes.
doesn’t take much time. - allows investigating a specific point in time in any target variables.
- cross-sectional data can be used for other surveys and research.
- outcome data allows for creating new theories, postulates, and proving hypotheses.
Cons
- data gets invalid if conducted over a longer span of period.
- doesn’t give data on cause and effect
- conflict of interest can skew or tamper the data reliability.
- can get complex in arranging or structuring the sampling pools.
Example: Almost all the institutes, including business, social science, psychology, education, retail, medicine, government, and religion, use cross-sectional surveys to examine. Companies buy cross-sectional research data to understand online spending behavior and offer coupons through mails or text messages.
#2 Longitudinal surveys
Contrary to cross-sectional surveys, researchers use the longitudinal survey methodical observation to collect data over a more extended period.
This could go upto weeks, months, or years. Studies like the impact of climate change or eating habits in a particular community last for more than decades.
The survey data can be quantitative or qualitative, depending on the researching requisites.
When do professionals use longitudinal surveys?
Researchers use the longitudinal study to unmask relationships between variables that have no link or relation with other background variables.
Pros
- useful in surveying lifespan and developmental issues that can span over extended periods.
- determining reasons for the developmental shifts.
- has a high level of focus and data validity.
- use repeated observations at individual levels. So, they are more potent in determining causal relationships than cross-sectional surveys.
- very flexible while collecting data. Surveyors can shift their focus.
- provide very accurate data with changing observations.
Cons
- take a tremendous amount of time, even before surveyors can develop a sign of any pattern.
- there is no predetermined-time span for surveying. Data collection may take years.
years of collection, and there are risks of gathering non-reliable data. - can be very expensive. Thus, surveyors can apply the study on small subject samples.
- respondents and surveyors— both often tend to drop out before the survey is over. Respondent-dropping or attrition threatens the validity of the study.
Examples: Study of bisphenol (BPA) and its impact on worker’s health in the food and packaging industry.
#3 Correlational surveys
One of the most critical and deployed surveys, correlational data study uncovers the relationship between two distinct variables and how they engage with each other.
The study doesn’t allow the external variable to interfere with the relational processing of two predefined variables. Used in science, health, and social science— correlational surveys investigate fascinating links between the world and people living in it.
The survey helps to understand the level of changes taking place in one variable when the other variable is manipulated or changed.
When do professionals use correlational surveys?
Researchers go for correlational studies when they are looking for more solid data than uncontrolled experiments. Experiments, where variables interact outside the laboratory, kills the purpose of the survey.
Pros
- help collect more data than experiments.
- provide a good starting point of study if surveyors or scholars get replaced.
- create a good ground for experiments to determine causation.
Cons
- only gives the relationship. Doesn’t shed light on why a relationship exists.
- fails to reveal which variable influences another. For example, wealth correlates with education. But the correlation graph doesn’t shed light on whether wealth brings education or education brings wealth.
- the third variable can be influencing both the variables. Example, living in California brings wealth and education.
Example: A correlation study between poverty and prosperity helps the government to come up with strong programs.
Nonresponse bias is a terrible blow on data reliability and validity. Researchers should aim for a 60% response rate or more.
Despite all the surveying methods— target samples often ignore or don’t respond to the questionnaire. The lack of response is called nonresponse bias.
If a survey method receives only a 20% response rate, it means the validity and reliability of data will suffer a deadly blow caused by 80% of nonresponse bias. Similarly, if the response rate is 10%, the nonresponse bias is 90%.
That’s why understanding how to design a survey, arrange & phrase the best survey question and answer styles, and select the correct survey respondents are vital for high response rates and less nonresponse bias.
To minimize nonresponse bias, surveying agencies and companies follow a multi or mixed-mode approach.
Surveys incorporating multi or mixed-mode methodology approaches have a higher response rate.
For example, mailed surveys (envelop surveys), when combined with e-mail or web follow-up, leads to higher response rates. But e-mail web surveys followed-up with envelope surveys have fewer response rates.
Again, this section needs a dedicated guide for clearing what works the best.
Keep following our blog posts for more detailed outlines on surveys and everything linked with it.